
How to Obtain Debug Logs from Innoactive Spatial app
This guide explains how to enable debug logging in the Innoactive Spatial app on Apple Vision Pro and export the logs for troubleshooting.
Overview
The Innoactive Spatial client for Apple Vision Pro includes a built-in debug logging system that captures system events, network activity, and error details. These logs are invaluable when diagnosing connection issues, streaming problems, or unexpected behavior.
Logs are automatically captured in the background and cleared after 24 hours.
Prerequisites
Innoactive Spatial app installed on your Apple Vision Pro
No active streaming session is required (logging works at all times)
Step-by-Step Instructions
Step 1: Open Settings
From the main screen of the Innoactive Spatial app, tap the gear icon in the top-right corner of the window to open the Settings panel.
Step 2: Navigate to Debug Mode
In the Settings panel, scroll down and tap Debug Mode (listed under "Development and troubleshooting"). This will open the Debug Mode settings screen.
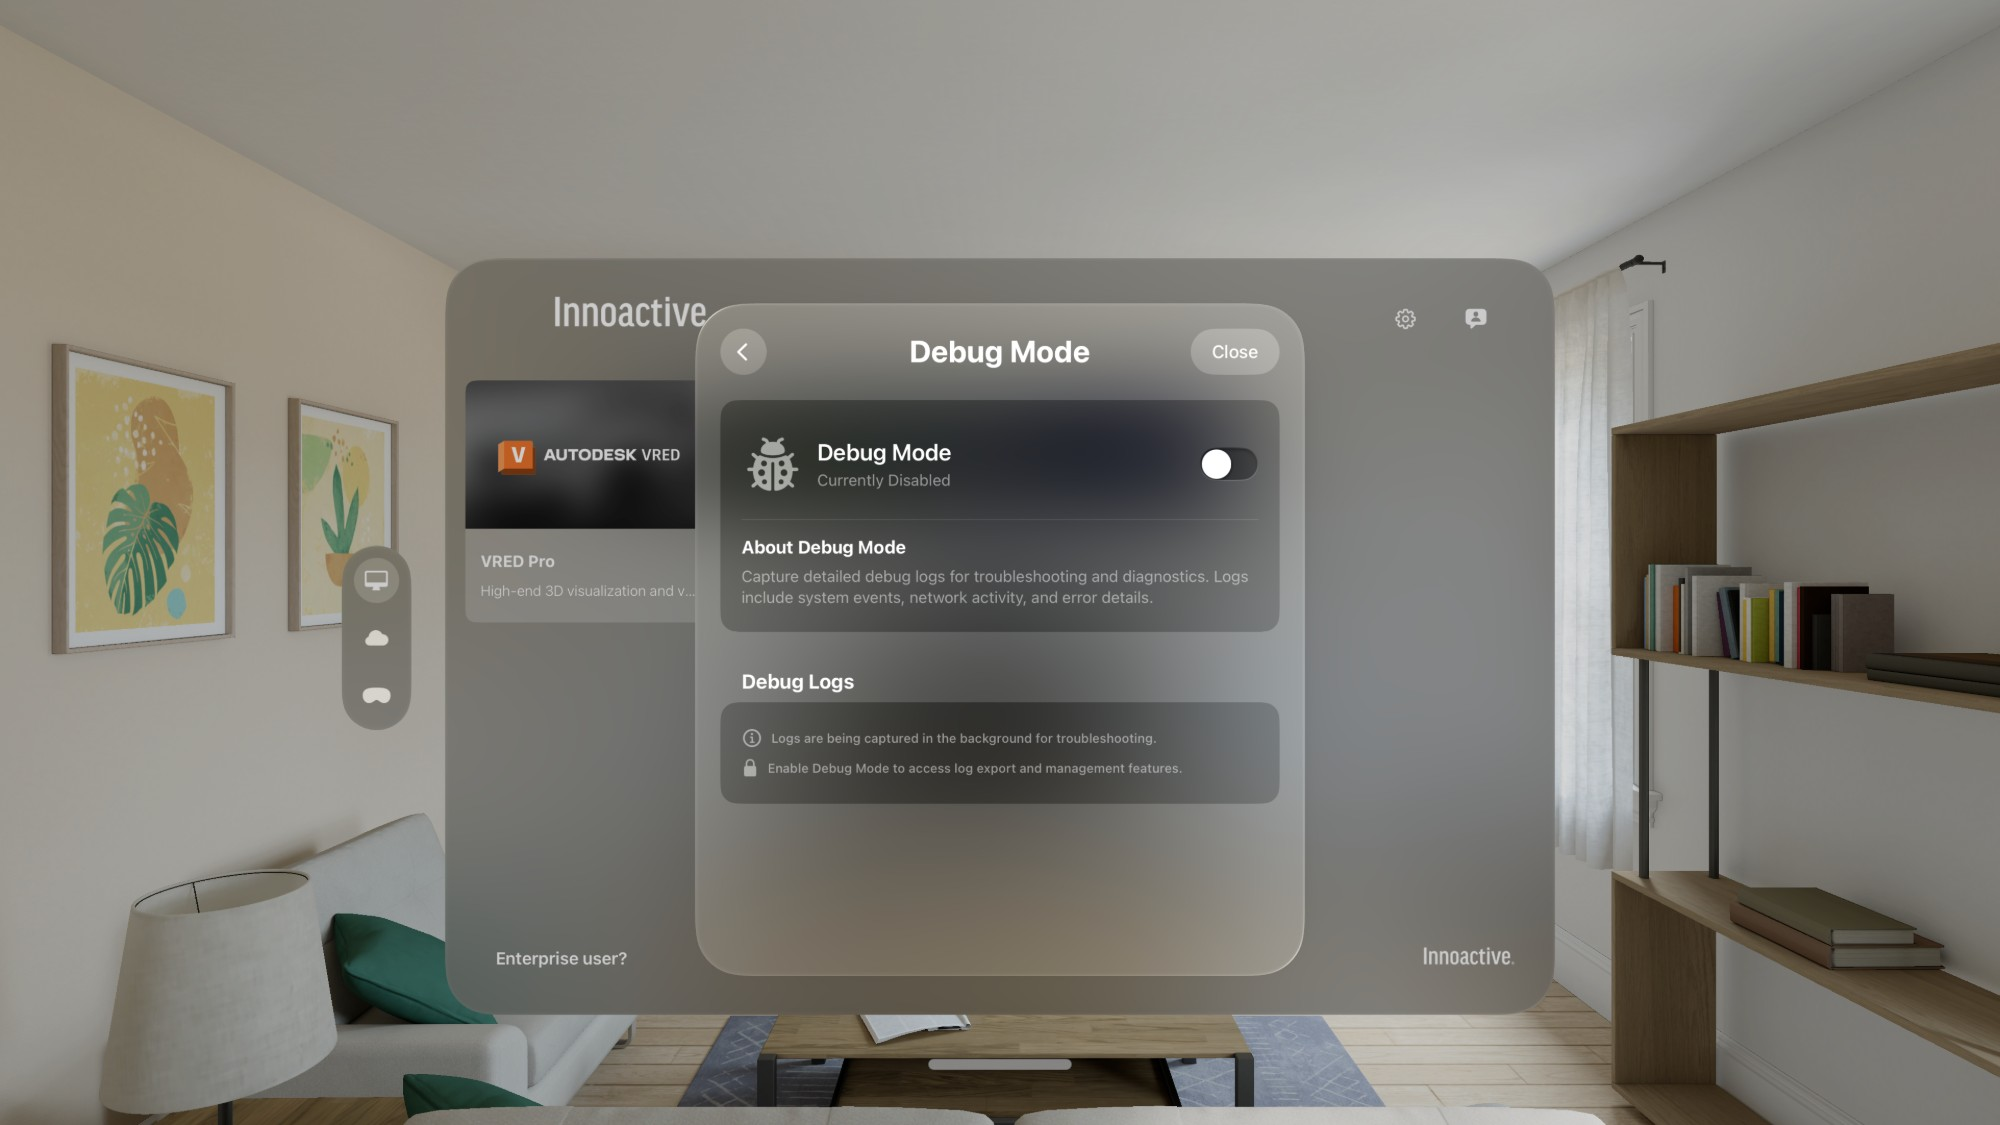
Step 3: Enable Debug Mode
At the top of the Debug Mode screen, you will see a Debug Mode toggle with a bug icon. If it shows "Currently Disabled", tap the toggle to enable it.
When Debug Mode is disabled, you will see an informational message:
"Logs are being captured in the background for troubleshooting."
"Enable Debug Mode to access log export and management features."
Once enabled, the Debug Logs section will expand to show additional controls.
Step 4: Review Log Information
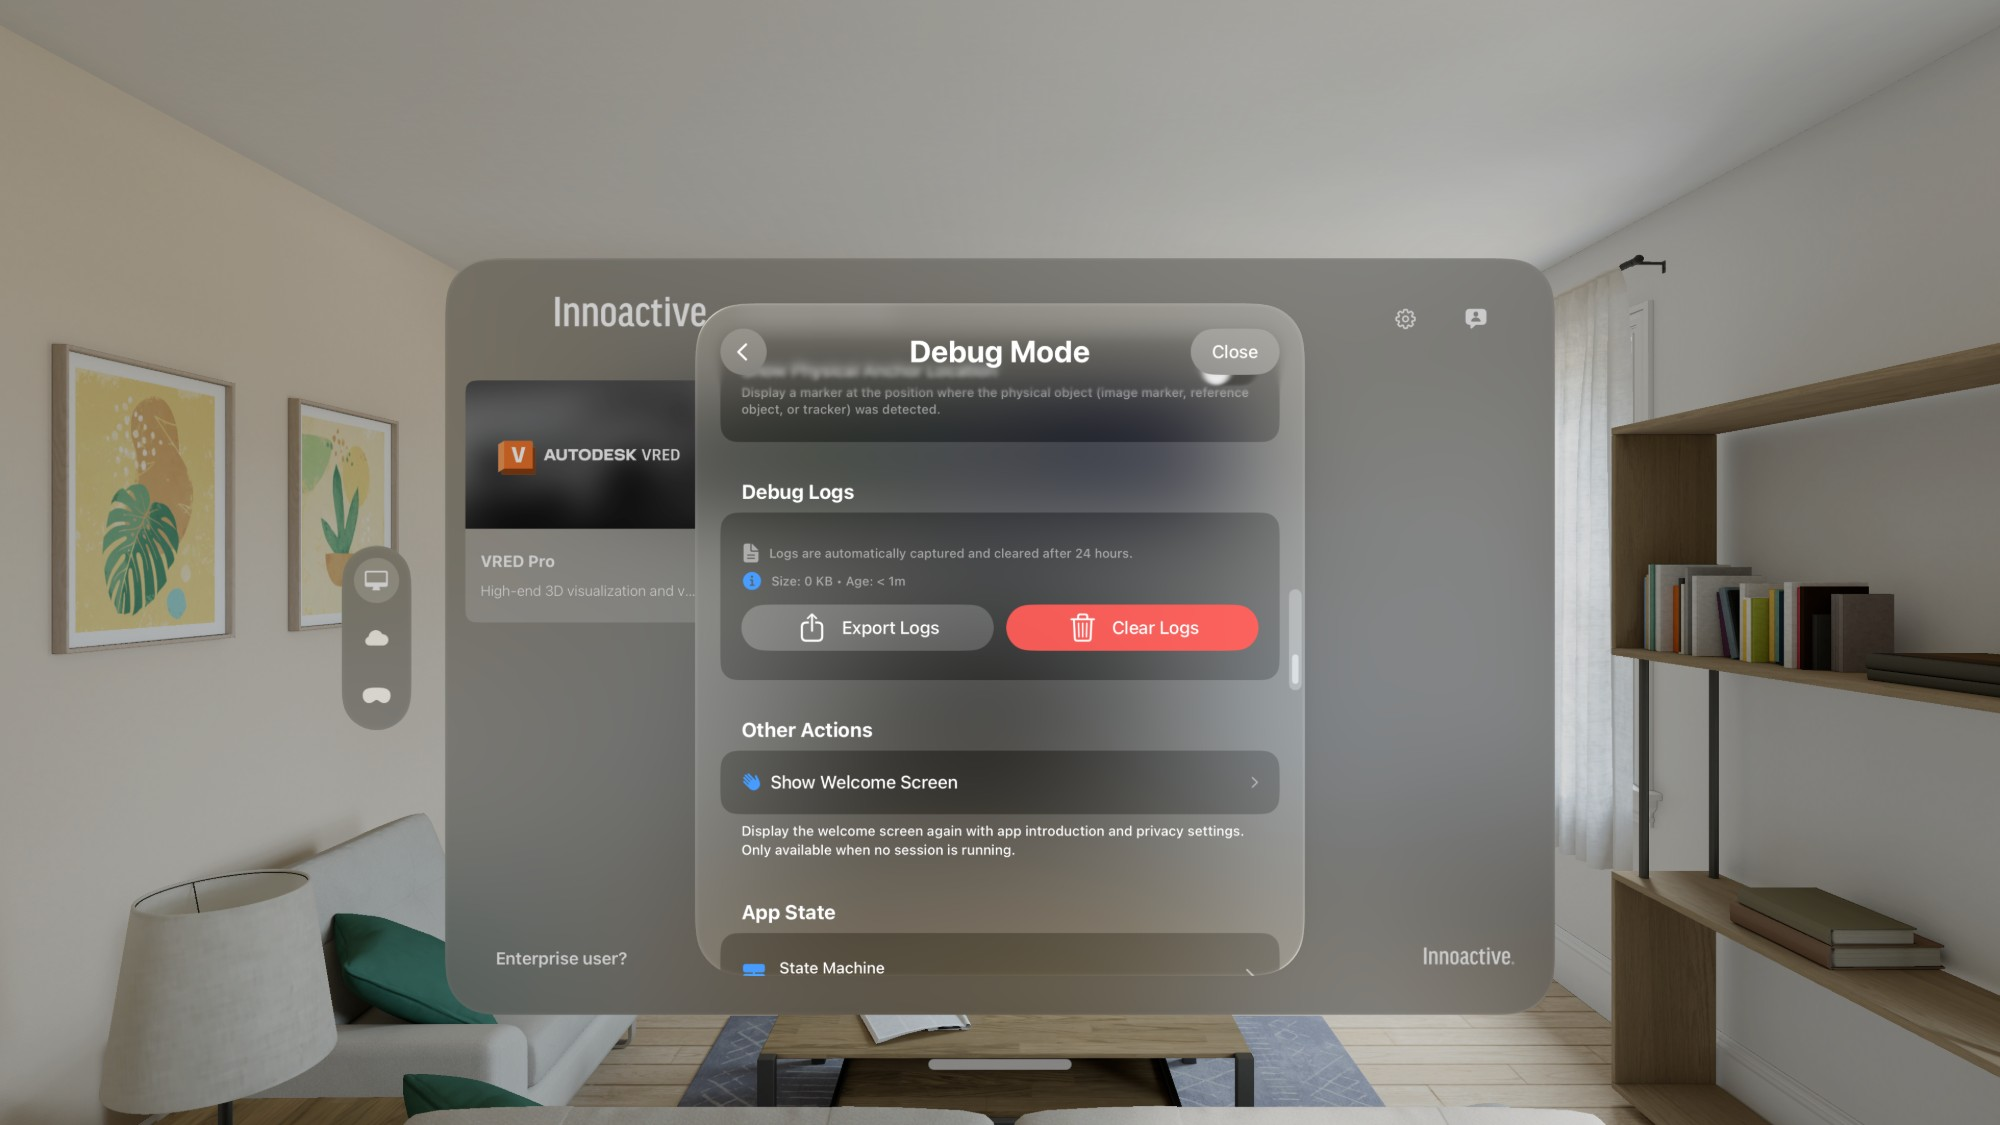
With Debug Mode enabled, the Debug Logs section displays:
Log size — the current size of the captured log data (e.g., "0 KB")
Log age — how long ago logging started (e.g., "Age: < 1m")
This information helps you verify that logs are actively being captured.
Step 5: Export Logs
Tap the Export Logs button (with the share icon) to export the captured logs. This will open the standard visionOS share sheet, allowing you to:
Save the log file to the Files app
Share via AirDrop to a nearby Mac
Send via email or other sharing methods
Step 6: Clear Logs (Optional)
If you want to start fresh, tap the Clear Logs button (red, with a trash icon) to delete all currently captured logs. This is useful before reproducing a specific issue so the exported logs contain only relevant data.
Recommended Workflow for Troubleshooting
Open Settings → Debug Mode
Enable the Debug Mode toggle
Tap Clear Logs to start with a clean slate
Close Settings and reproduce the issue you are experiencing
Return to Settings → Debug Mode
Tap Export Logs and share the file with the support team
Additional Debug Features
The Debug Mode screen also provides access to:
Show Physical Anchor Locator — displays a marker at the position where a physical object (image marker, reference object, or tracker) was detected
Show Welcome Screen — re-displays the app introduction and privacy settings (only available when no session is running)
App State / State Machine — view the current internal state of the application
Notes
Logs are automatically captured in the background even when Debug Mode is disabled. Enabling Debug Mode simply unlocks the export and management features.
Logs are automatically cleared after 24 hours.
Log files may contain network addresses and session identifiers. Handle them with appropriate care.